Posted by Afif Sarwar | Last Updated: December 15, 2025
Executive Summary
The Global Ad Cost Index 2026 provides a country-by-country benchmark of CPM and CPC rates across major advertising platforms, including Meta (Facebook & Instagram), Google Ads, and TikTok.
Based on $5M+ in managed ad spend (2024–2025) and validated against World Bank macro-economic indicators and Statista industry benchmarks, this index reveals a widening global pricing imbalance that sophisticated advertisers can exploit.
Key Findings:
- Tier 1 Inflation: Advertising costs in the United States, United Kingdom, and Canada increased by ~12% YoY, driven by retail media saturation and reduced signal quality.
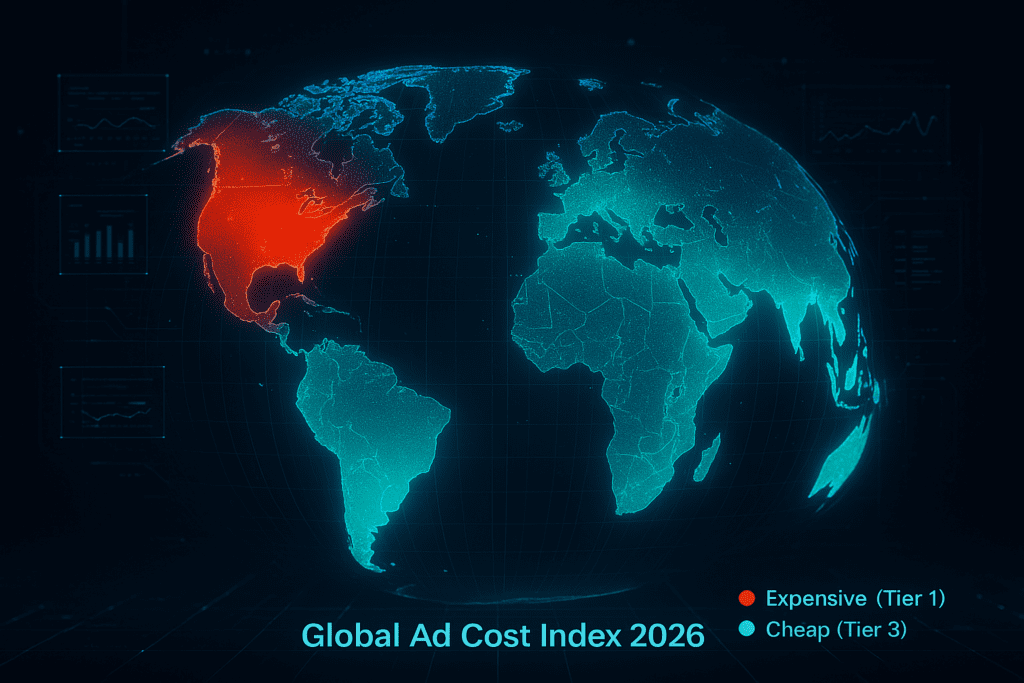
- The Arbitrage Gap: The effective cost of acquiring a user in the United States is now 6–7× higher than in Brazil or Southeast Asia, despite comparable engagement metrics.
- Misleading Averages: The weighted global average Meta CPM is $6.59, but real-world CPMs range from $1.50 (Nigeria) to $23.00+ (USA).
Actionable Insight: Advertisers relying solely on Tier 1 traffic without high Average Order Value (AOV) or backend monetization are increasingly unprofitable.
This index is designed to support budget forecasting and ROAS modeling. Always validate assumptions using our CPM vs CPC Profit Calculator before scaling spend.
Table of Contents
The State of Global Advertising in 2026

The era of “cheap traffic” in Western markets has ended. As of Q4 2025, the barrier to entry for cold traffic in North America is at an all-time high. Broad targeting strategies without advanced conversion infrastructure (LTV stacking, upsells, retention) are structurally unviable.
At the same time, emerging economies are digitizing rapidly. Smartphone penetration, mobile payments, and platform maturity have created a persistent geo-pricing inefficiency known as Geo-Arbitrage: acquiring attention in underpriced regions and monetizing it through scalable digital offers.
Market Segmentation Framework
To remove noise from averages, we classify all countries into three strategic zones.
Zone 1: Premium Markets (Tier 1)
- Characteristics: High GDP per capita, saturated ad inventory, extreme auction competition.
- Strategic Use: Retargeting only, High-LTV Enterprise offers.
- Required ROAS: 3.0+
| Country | Avg. CPM (Meta) | Avg. CPC (Google) | YoY Trend |
|---|---|---|---|
| United States | $23.00 | $2.69 | ⬆️ +12% |
| Australia | $18.50 | $2.10 | ⬆️ +5% |
| United Kingdom | $10.31 | $1.95 | ⬆️ +8% |
| Canada | $13.40 | $1.75 | ⬆️ +6% |
| Germany | $10.05 | $1.45 | ⬆️ +4% |
| New Zealand | $11.20 | $1.60 | ⬆️ +3% |
Analysis: The United States remains the most expensive advertising market globally. Cost inflation is driven by sustained demand from global e-commerce brands and retail media expansion. In this environment, Lifetime Value (LTV) not CPM optimization determines profitability.
Zone 2: Efficiency Markets (Tier 2)
- Characteristics: Strong English proficiency, high digital payment adoption, moderate competition.
- Strategic Use: SaaS expansion, B2B lead generation, International DTC scaling.
| Country | Avg. CPM (Meta) | Avg. CPC (Google) | Primary Language |
|---|---|---|---|
| Sweden | $9.10 | $1.30 | English / Swedish |
| France | $8.05 | $1.15 | French |
| Spain | $5.80 | $0.85 | Spanish |
| UAE | $6.50 | $1.40 | English / Arabic |
| Singapore | $12.00 | $1.80 | English |
| South Africa | $4.20 | $0.65 | English |
The Nordic Efficiency Effect: Despite high GDP per capita, Scandinavian CPMs remain structurally lower than US and UK benchmarks. English fluency exceeds 85%, making these regions ideal for English-first SaaS and B2B campaigns.
Zone 3: Volume Markets (Emerging & Scale)
| Country | Avg. CPM (Meta) | Avg. CPC (Google) | Scale Potential |
|---|---|---|---|
| Brazil | $4.20 | $0.35 | ⭐⭐⭐⭐⭐ (Very High) |
| India | $2.60 | $0.20 | ⭐⭐⭐⭐⭐ (Max) |
| Philippines | $3.50 | $0.28 | ⭐⭐⭐⭐ (High) |
| Indonesia | $2.80 | $0.18 | ⭐⭐⭐⭐⭐ (Max) |
| Nigeria | $1.50 | $0.12 | ⭐⭐⭐ (Med) |
| Vietnam | $2.10 | $0.15 | ⭐⭐⭐⭐ (High) |
- Characteristics: Massive population scale, mobile-first behavior, very low ad costs.
- Strategic Use: App installs, Content arbitrage, Low-ticket digital products.
Data Quality Warning: Bot and low-intent traffic rates in emerging markets can be 20–30% higher than Tier 1 regions. Never optimize for link clicks. Always optimize for purchase or value-based events to force algorithmic filtering.
Platform Cost Index (2026)
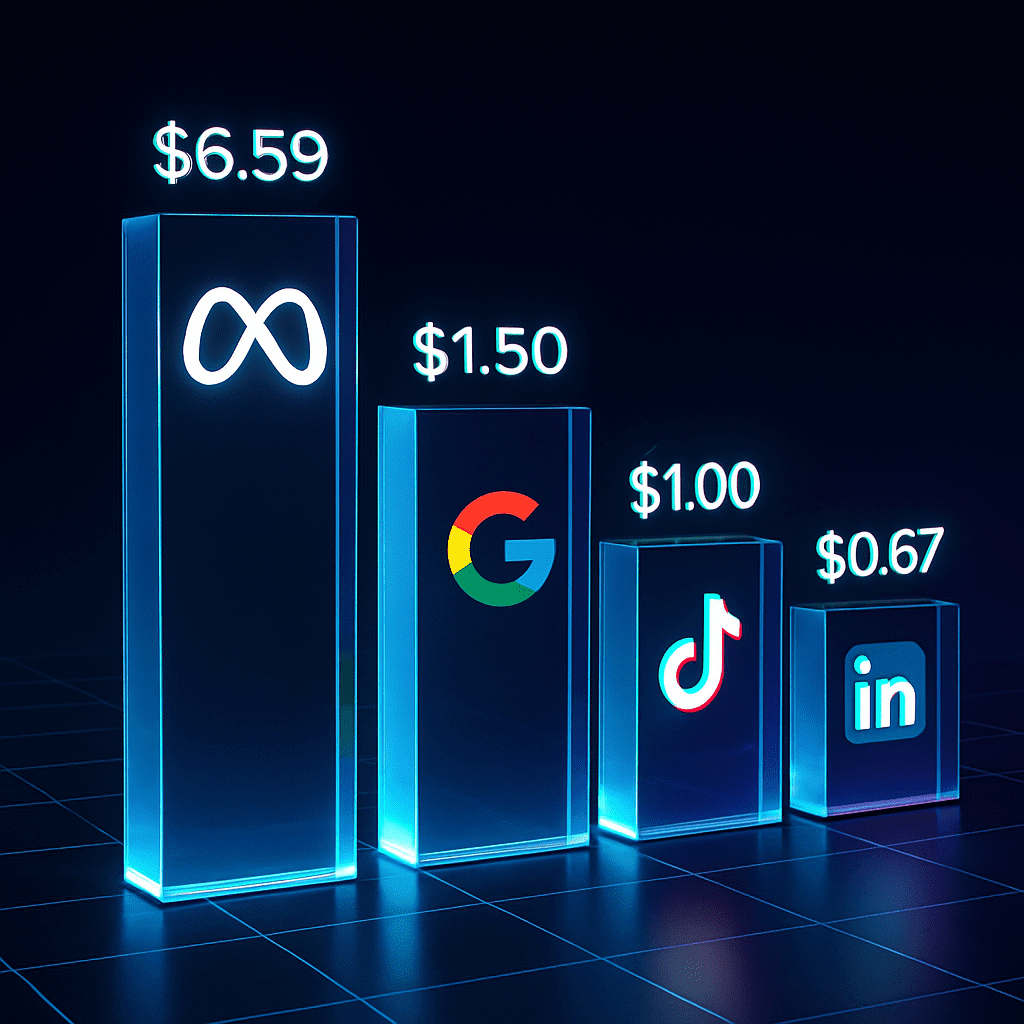
Platform Cost Comparison
Average CPMs and outlook for the 2026 fiscal year.
| Platform | Global Avg. Cost | Best Use Case | 2026 Outlook |
|---|---|---|---|
| Meta (FB/IG) | $6.59 CPM | E-commerce scale | Stable |
| Google Search | ~$1.50 CPC | High-intent demand | Rising |
| TikTok | $3.50 CPM | Viral & Gen-Z | Underpriced |
| $28.00 CPM | Enterprise B2B | Very Expensive |
TikTok Arbitrage Insight: In Tier 2 and Tier 3 markets, TikTok CPMs frequently fall below $1.00, creating the highest current ROI opportunity for performance advertisers.
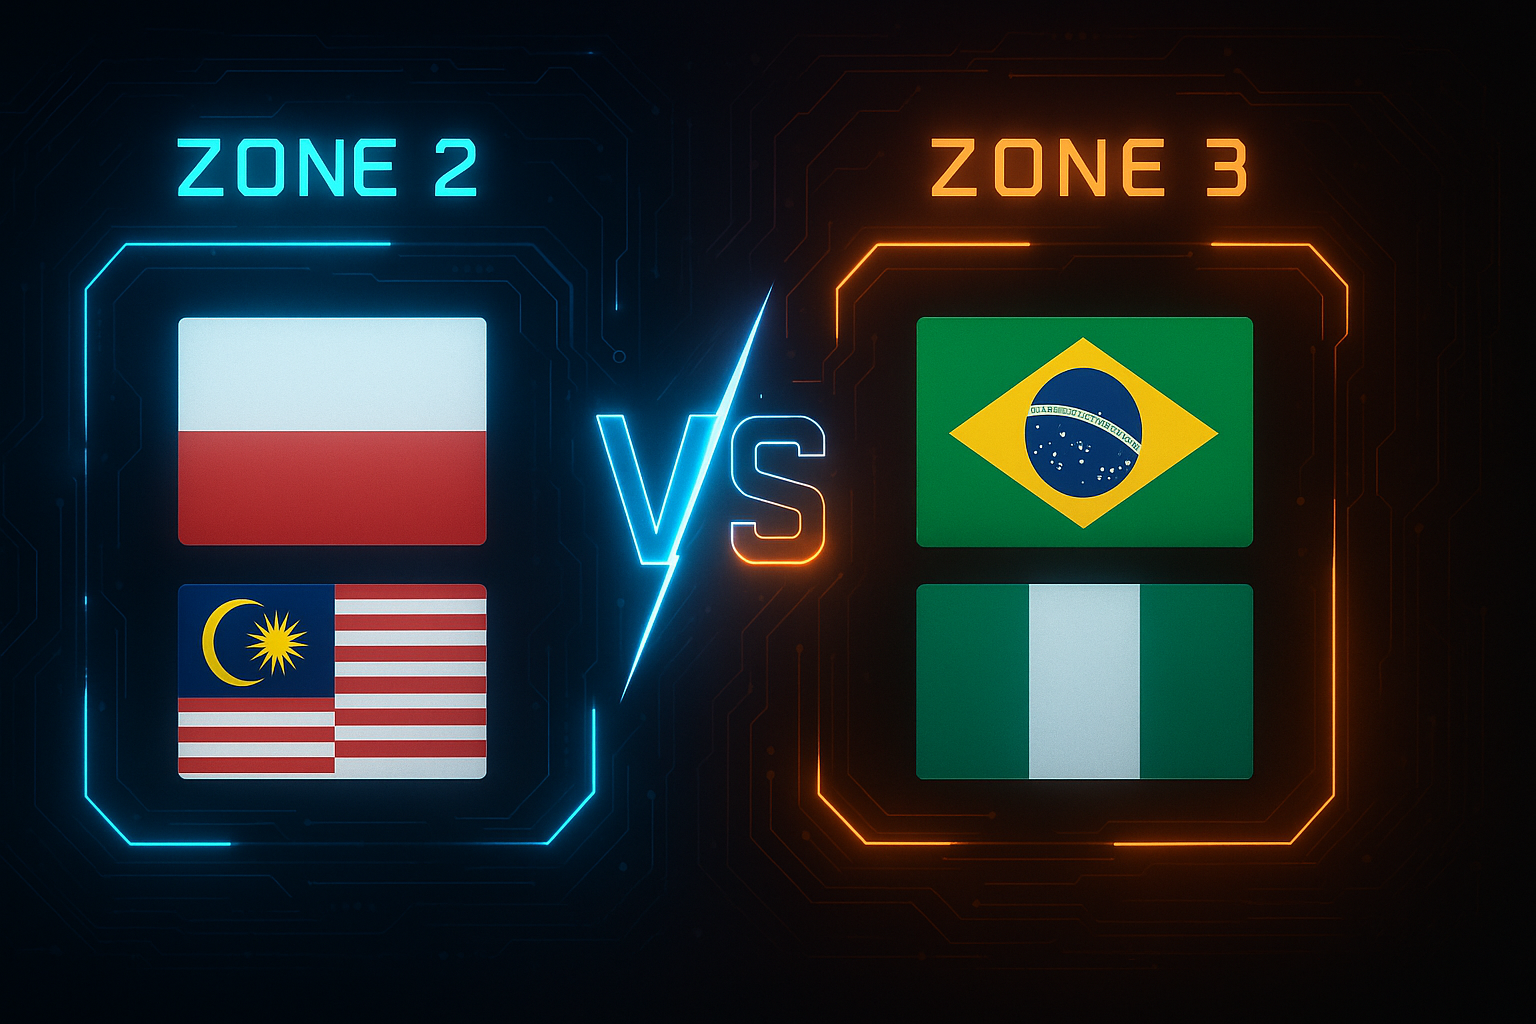
The Cyanide Efficiency Index: Top Arbitrage Markets
Using our internal Efficiency Index (GDP per capita ÷ CPM), the following countries rank highest for sustainable ROAS in 2026:
- Brazil: Mature e-commerce ecosystem with Pix instant payments.
- Poland: EU regulatory trust at half the cost of Germany.
- Philippines: The global hub for English-first B2B lead generation.
- Malaysia: High purchasing power with low friction.
- Mexico: Cultural proximity to US brands with uncrowded inventory.
Methodology & Data Sources
This index is built using a multi-layer validation framework:
- Proprietary Data: Aggregated campaign data from Cyanide Tech managed accounts (2024–2025).
- Macro-Economic Data:World Bank Open Data(GDP, connectivity).
- Industry Benchmarks: Cross-referenced with Statistaand Business of Appsannual reports.
Disclaimer: All figures represent auction averages, not guarantees. Actual costs vary based on creative quality, targeting, and bidding strategy.
Crunch the Numbers
Benchmarks alone do not create profit. Before scaling spend, calculate whether your business model can survive real auction economics using our Free ROAS Calculator.
Frequently Asked Questions
2026 Advertising Benchmarks
Key insights into global CPM trends and forecasts.