Writen By: Afif Sarwar | Last Updated: December 17, 2025
The Law of Capital Velocity
In the absence of infinite capital, time is not a resource; it is a filter.
Most founders measure business health using Lifetime Value (LTV) a metric derived from future assumptions. Survival, however, is determined by Payback Period a metric derived from current liquidity.
LTV estimates how much you might earn. Payback determines whether you will survive long enough to collect it. For bootstrapped operators, the gap between these two metrics is where companies die.
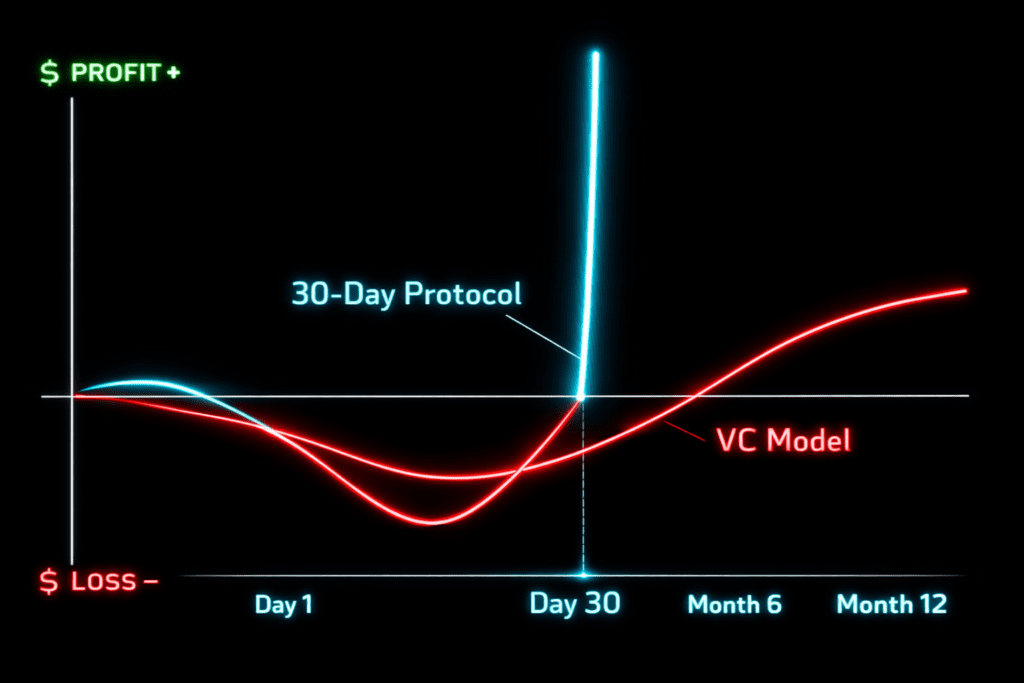
This doctrine defines the 30-Day Payback Protocol: a system for using Geo-Arbitrage to recover ad spend before the credit card bill is due.
Executive Summary
- The Trap: Optimizing for LTV assumes infinite runway. If cash runs out in Month 6, your “3-year LTV” is irrelevant.
- The Constraint: Ignore LTV. Optimize solely for Payback Period (time to break even).
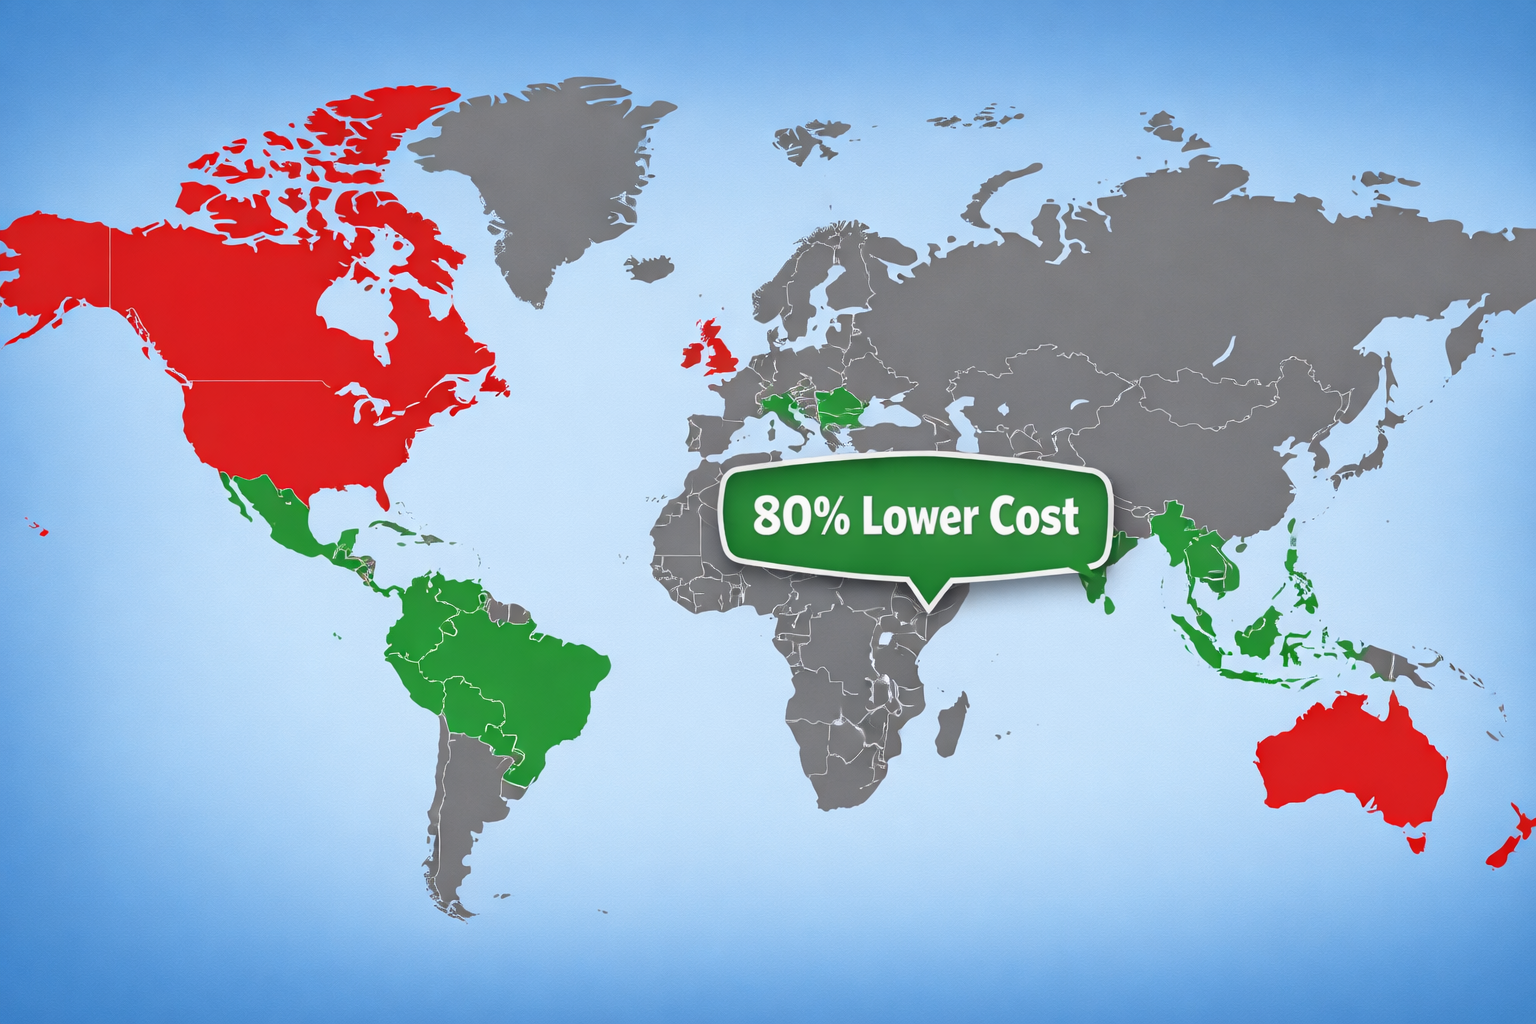
- The Method: Use Geo-Arbitrage to collapse CAC by 80% while pricing remains global.
- The Result: A dollar recovered in 30 days can be reinvested 12× per year. That is the definition of capital-efficient growth.
Table of Contents
The Law of Capital Velocity (The Constraint)
Growth Rate≤Capital Turnover Rate
If your payback period is 180 days, your capital can turn over only 2× per year. No growth strategy can outrun that ceiling. This is not strategy. It is physics.
The Physics of Cash Velocity
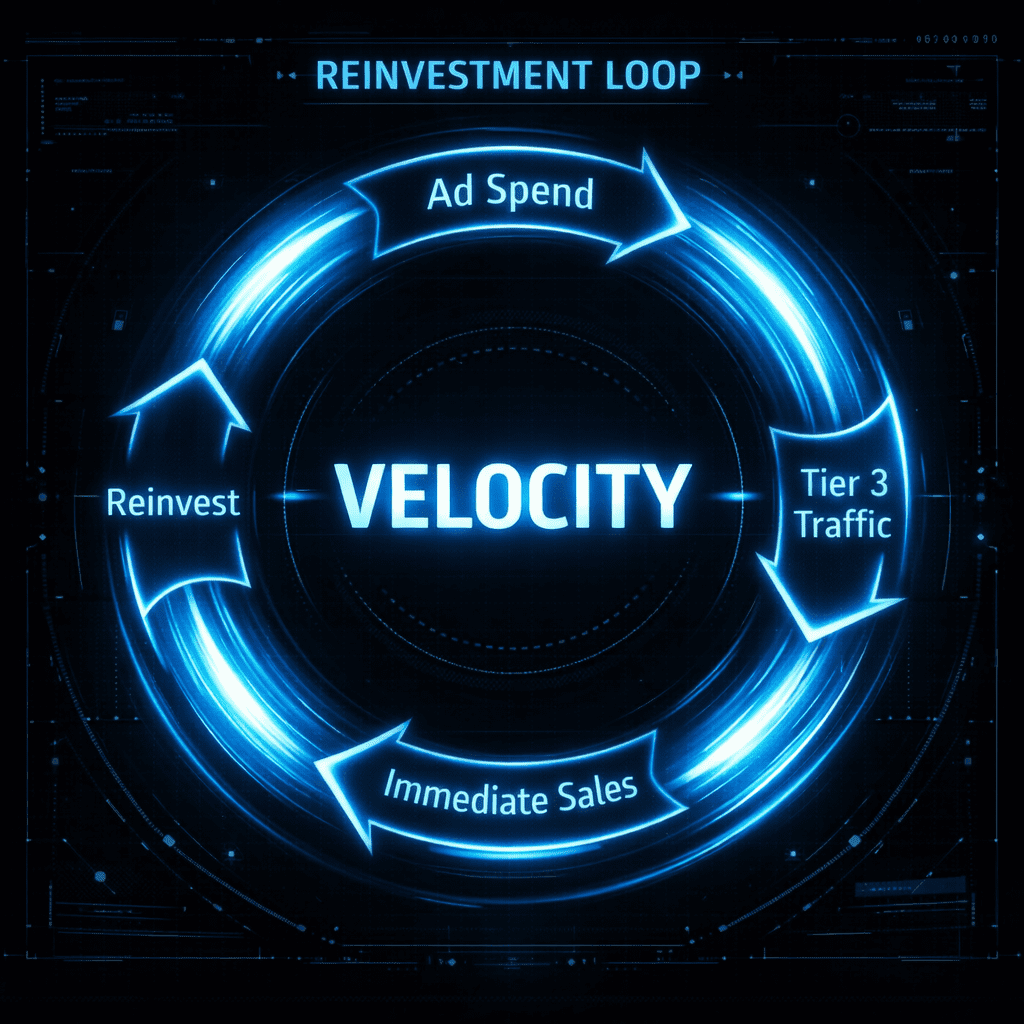
In digital advertising, money has velocity. If $100 is deployed today, the speed at which it returns determines the maximum growth rate of the business.
Scenario A: The VC Model (Low Velocity)
You acquire a customer who pays $10/month. Industry benchmarks from Andreessen Horowitz (a16z) show that venture-backed startups often accept 12–18 month payback periods.
- Capital is frozen for nearly a year.
- Growth requires external financing to bridge the gap.
Scenario B: The Cyanide Model (High Velocity)
You acquire a customer for $20 using Tier 3 Efficiency Markets, and the customer pays $10/month.
- Payback occurs in 2 months.
- Over the same timeline, the same $100 produces 5× the leverage of Scenario A.
Speed of return matters more than total return.
The Equation: Crashing CAC
You cannot shorten payback by “wishing” for higher prices. You shorten payback by destroying CAC. This is why we built the Global Ad Cost Index 2026.
By shifting acquisition from Red Zones (USA, UK) to Green Zones (Poland, Malaysia, Brazil), CPMs drop by 500–800% while pricing remains global. This is not localization. This is market inefficiency extraction.
- Reference: Global Ad Cost Index 2026
- Reference: Geo-Arbitrage Marketing Guide 2026
The 30-Day Payback Protocol (Step-by-Step)
1. Target
Use the Digital Nomad Targeting Hack to isolate Tier 1 buyers residing in Tier 3 markets. These users have Western purchasing power but local ad costs.
2. Offer
Sell a high-margin digital product (SaaS, course, template). Marginal cost must approach zero.
3. Pricing
Use front-loaded pricing (setup fee, annual plans) to recover ad spend on the first transaction.
The Objective: Cash Neutrality
Your goal is not profit on Day 1. Your goal is cash neutrality.
If you spend $50 and recover $50 immediately, you acquired a customer for free. All future revenue is optional upside.
The Kill Rule (Non-Negotiable) If blended payback exceeds 90 days after optimization, stop acquisition. You are no longer growing. You are financing churn.
The Enterprise Exception (And Why You Are Likely Not It)
Long payback periods are rational only under contractual certainty.
If you sell enterprise software with upfront annual payments or legally enforceable multi-year contracts, your LTV is secured by law, not hope.
For the remaining 95% of businesses monthly subscriptions, usage-based models, prosumer tools deferred revenue is not an asset. It is liquidity risk. Without the contract, patience is not a virtue. It is exposure.
The Liquidity Stress Test
Most acquisition models fail when CAC rises by 20%. Use the diagnostic below to determine whether your business is a cash engine or a liquidity trap.
Payback Period Calculator (Survival Audit)
Inputs: Customer Acquisition Cost (CAC) | Upfront Revenue (Day 1) | Monthly Recurring Revenue (MRR)
Liquidity Stress Test
The Verdict:
- 🟢 0–30 Days: Cash Engine (Safe)
- 🟡 30–60 Days: Credit Risk (Requires Reserves)
- 🔴 60+ Days: Liquidity Trap (Danger)
(Target: recover ad spend before the card statement closes.)
Why LTV Is a Vanity Metric
LTV is a prediction. It is a guess about the future. Payback is reality. It is cash in the bank today. If you are bootstrapping, you cannot eat LTV. You can only eat cash flow.
Final Takeaway
You do not need to be a unicorn. You need to be a cockroach. Cockroaches survive because they are efficient.
- Lower costs using Geo-Arbitrage.
- Shorten payback using front-loaded pricing.
- Reinvest recovered cash faster than competitors.
Start by auditing your acquisition costs using the Global Ad Cost Index 2026.
Frequently Asked Questions
What is a good payback period for a bootstrapped SaaS?
30- 60 days. Venture-backed firms may tolerate 12–18 months. Bootstrapped operators cannot.
Why is LTV considered a vanity metric?
Because it assumes future behavior that is not contractually guaranteed. Cash flow pays bills today.
Does the 30-Day Protocol work for high-ticket services?
Yes. It works better. If you spend $500 to acquire a client who pays $1,000 upfront, payback is Day 0.
Source Note: This doctrine is derived from $5M+ in direct-response ad spend, combined with industry benchmarks from Andreessen Horowitz, Meta Investor Relations, and observed CPM data across Tier 1–Tier 3 markets.