Skip to content
Cyanide Tech Logo Cyanide Tech

Tech Blog

  • Home
  • Global Ad Strategy
  • Data & Benchmarks
  • Unit Economics
  • Important links
    • About Us
    • Contact US
    • Privacy Policy
    • Terms and Conditions
    • Disclaimer
  • Tools
    • Instagram & Facebook CPC Calculator
    • ROAS Calculator
    • Shopify Margin Calculator

Payback Period

Neon line graph comparing payback periods. The red line (VC Model) dips deep and recovers in 12 months. The cyan line (Cyanide Protocol) dips slightly and profits in 30 days.
Posted inUnit Economics

The Law of Capital Velocity: Why LTV is a Vanity Metric (Unit Economics)

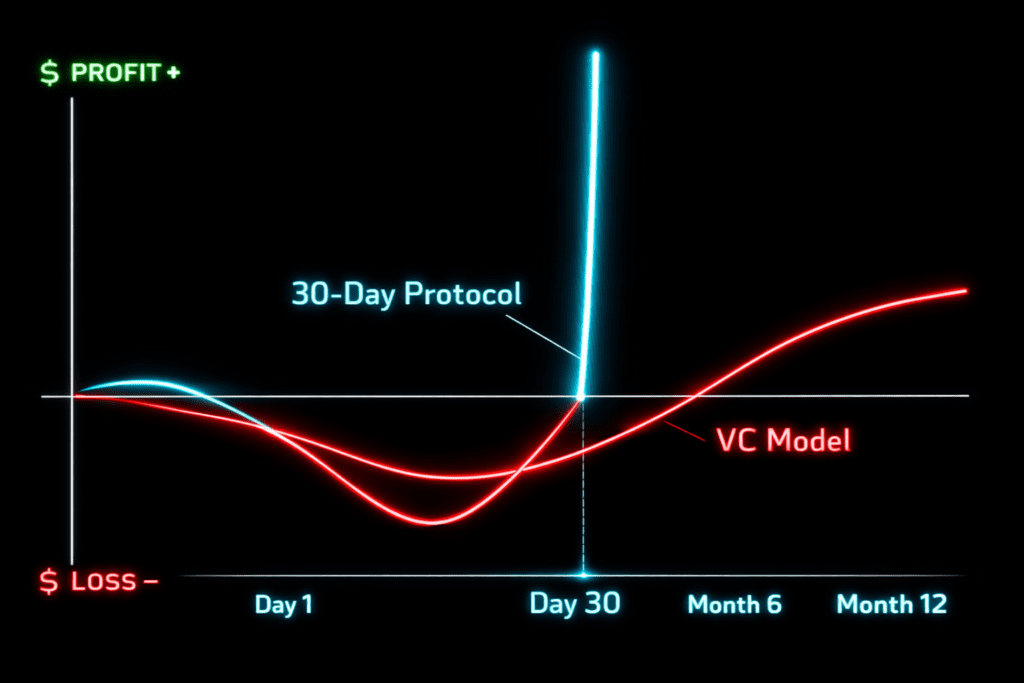
Writen By: Afif Sarwar | Last Updated: December 17, 2025 The Law of Capital Velocity In the absence of infinite capital, time is not a resource; it is a filter.…
Posted by Afif Sarwar December 17, 2025
Affiliate marketing banner promoting Hostinger web hosting, featuring bold text that reads “Speed Up Your Website With Hostinger,” a red Start Now button, benefit points like 30-day money-back guarantee and 99.9% uptime, a sprinting athlete graphic, and a discount offer using code CYANIDETECH.
📈

ROAS Calculator

Calculate your Facebook Ads profit margins instantly.

Try it Free

Recent Posts

  • The “Digital Nomad” Targeting Hack: Reaching Tier 1 Buyers at Tier 3 Prices
  • Case Study: Tier 2 vs. Tier 3- Which Markets Actually Yield Higher ROAS?
  • The Global Ad Cost Index 2026: CPM & CPC Benchmarks by Country
  • CPM vs. CPC: The SaaS Strategy Guide + Profit Calculator [2026]
  • The Ultimate Guide to Geo-Arbitrage Marketing (2026 Edition)
Cyanide Tech Logo
Important Links
  • Home
  • About Us
  • Contact US
  • Disclaimer
  • Privacy Policy
  • Terms and Conditions
Free Tools
  • Upwork Fee Calculator
  • Instagram & Facebook CPC Calculator
  • Free Shopify Margin Calculator
  • Free ROAS Calculator
Cyanide Tech Logo
© 2025 Cyanide Tech — All rights reserved.
Scroll to Top